
Drag Reduction System (DRS)
Wanting to get some in depth knowledge about competition car aerodynamics, the performance of a Drag Reduction System DRS should not pass unnoticed. In the following video, two engineers at Caterham F1 show us how the DRS works in F1.
According to the video, the main feature in a DRS is a flap with two positions (ON/OFF) that at the request of the driver, and if permitted, changes its angle of incidence. This will change the flow pattern around the aileron and thus reduce drag allowing for faster top speeds and aiding in overtaking. To see this flow pattern changes I took the geometry (Fig. 1) from STAR-CCM+ tutorial files and made some minor changes so I could pivot the flap at will around its tailing edge.
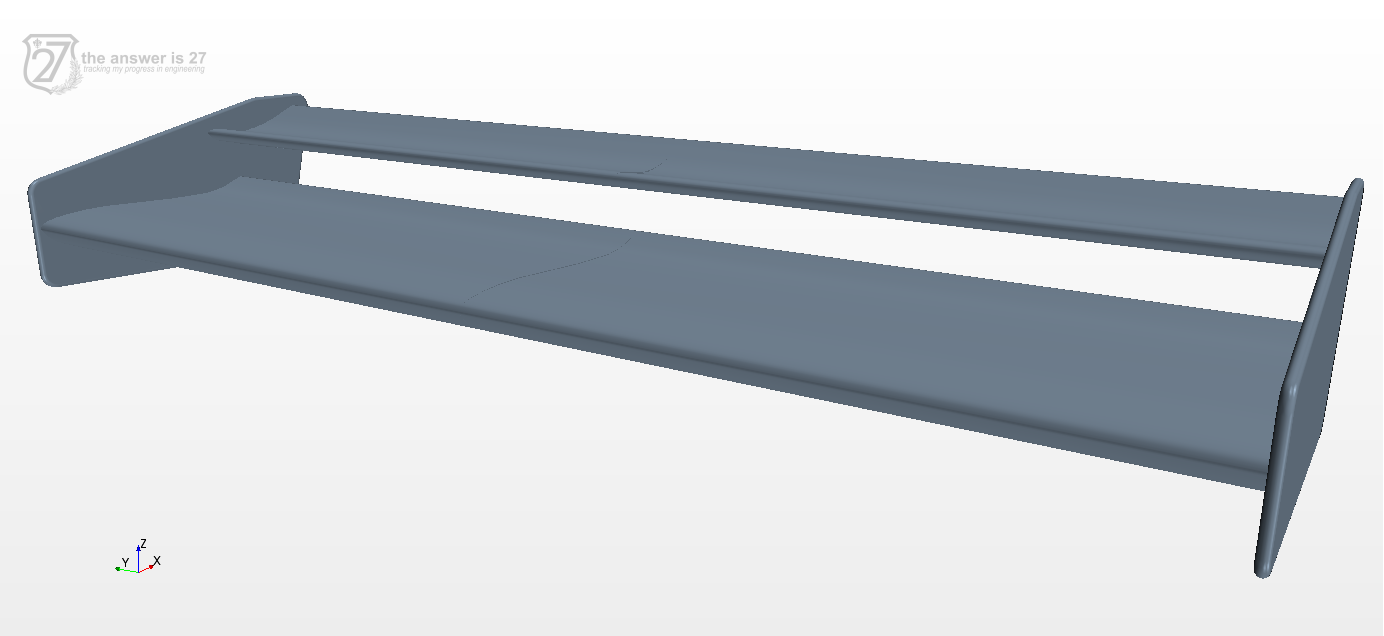
Figure 1. Simplified wing geometry for DRS analysis. The aileron has a wing span of 1.4 meters and a main chord of 0.3 meters whilst the flap has a chord of 0.15 meters.
I maintained the mesh and physic model parameters to that from the tutorial:
- Free stream: 100 kph
- Turbulence model: SST (Menter) K-Omega
- Three dimensional, coupled, steady flow
- Polyhedral mesh with prism layer
Results
When the DRS is in off position, the flap will be responsible for the wing generating maximum downforce —at a cost of drag—. As we can see in Figure 2, there is a bigger high pressure region above the wing as the air has a smaller gap to pass through, and thus more air is forced above the flap.
The air moving upwards with the DRS OFF is clearly visible in Figure 3 where the streamlines are represented coloured by velocity. In this case the DRS works as a slotted flap does in an aircraft, allowing high pressure airflow energize the lower pressure over the bottom, thereby delaying flow separation, as can be deduced by looking at the turbulence kinetic energy in Figure 4. In this case, the flap is responsible for 70 % of the drag generated by the wing assembly while contributing only a 20 % to the generation of downforce.
On the other hand, with the DRS ON, streamlines are less disturbed, thus contributing to a reduction in drag. Now, flap’s proportion in drag generation goes down to 61 % whilst maintaining about 20 % share in downforce.
Globally, the DRS reduces both drag and downforce, the former being steeper. In this case, there is a 31 % reduction in drag at 10 degrees, which is about 3 times the reduction obtained in an F1 race car according to Simon McBeath [2]. Nonetheless, the trend in both graphs (his and mine) are similar, while the discrepancies are attributable to geometric differences.
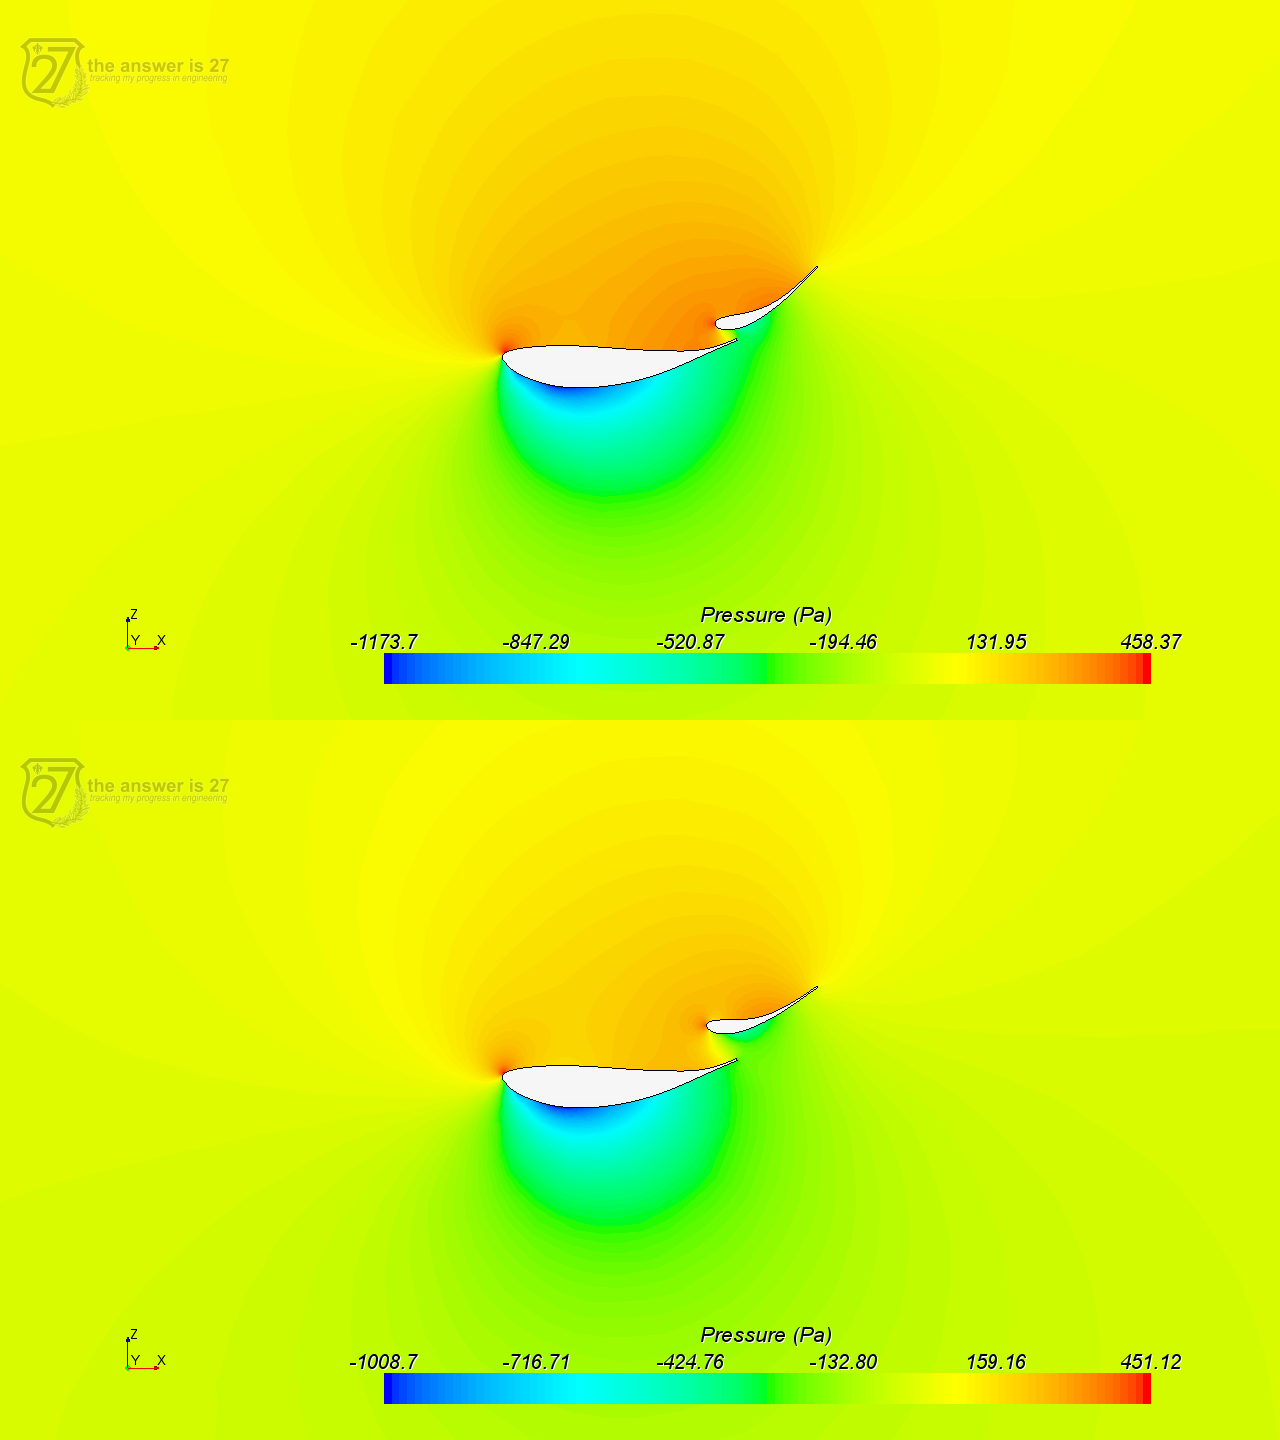
Figure 2. Contours of Pressure at DRS OFF (above) and at flap pivoted 10 degrees (DRS ON, below)
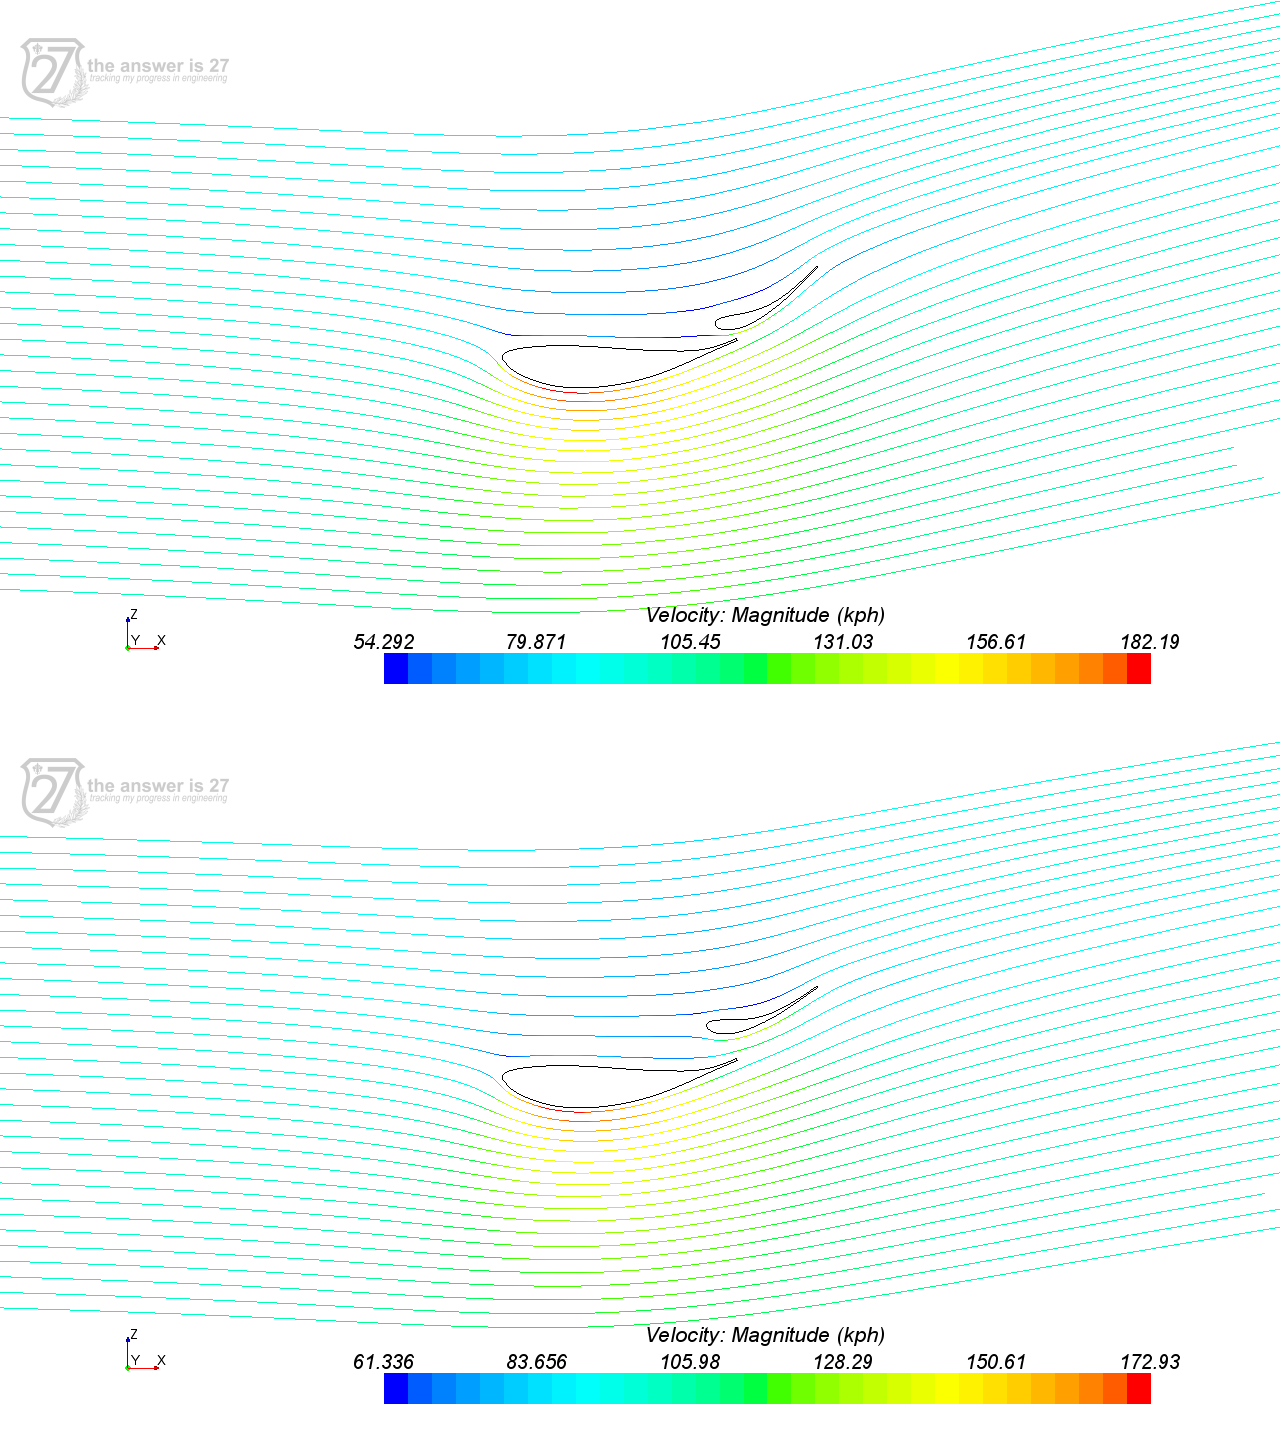
Figure 3. Streamlines at DRS OFF (above) and at flap pivoted 10 degrees (DRS ON, below). Coloured by velocity.
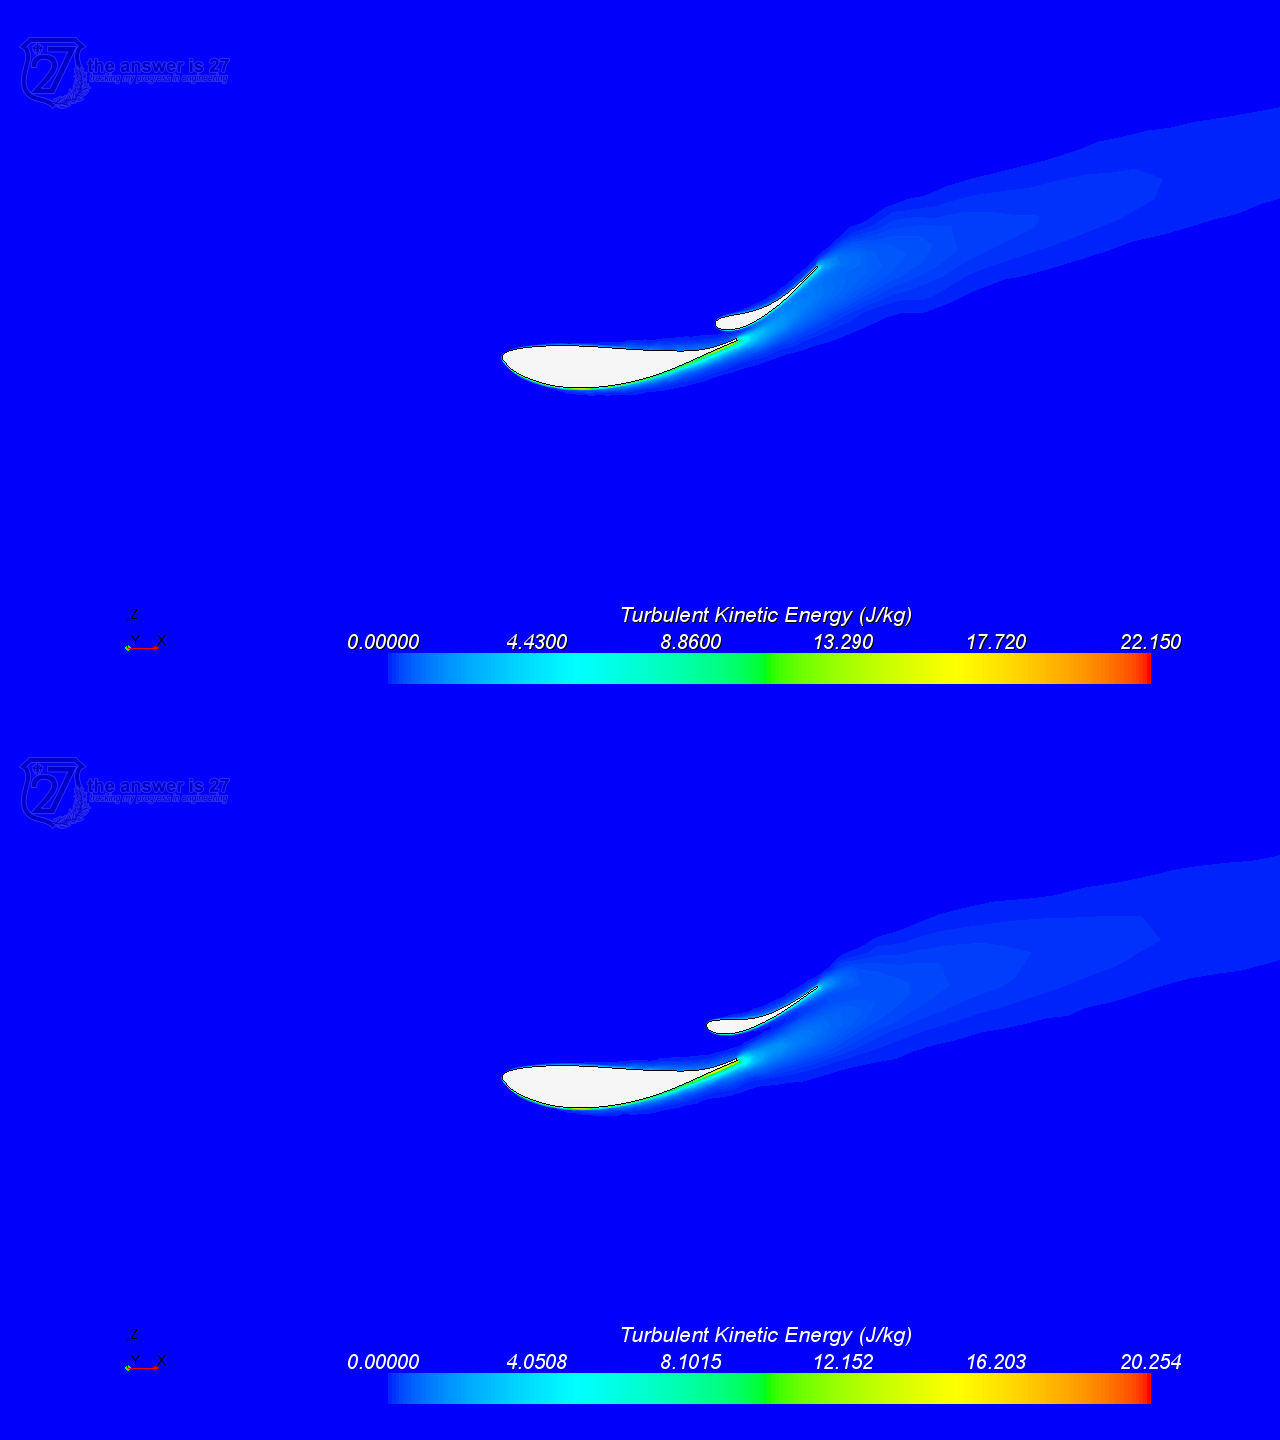
Figure 4. Turbulent kinetic energy at DRS OFF (above) and at flap pivoted 10 degrees (DRS ON, below).
References
[1] User Guide STAR-CCM+ Version 8.06. 2013.
[2] Racecar-engineering.com. 2011. DRS: The Drag Reduction System explained | Racecar Engineering. [online] Available at: http://www.racecar-engineering.com/articles/f1/drs-the-drag-reduction-system/ [Accessed: 14 Jan 2014].