
Data logger: test session at 1st RallyMix de Barbadás
Having improved the code after checking the data from the last Rally Eurocidade Tui-Valença, I was ready to test again the data logger. The new scenario: Primeiro RallyMix de Barbadás.
Steering angle and throttle position sensors are to come on future revisions of the data logger.
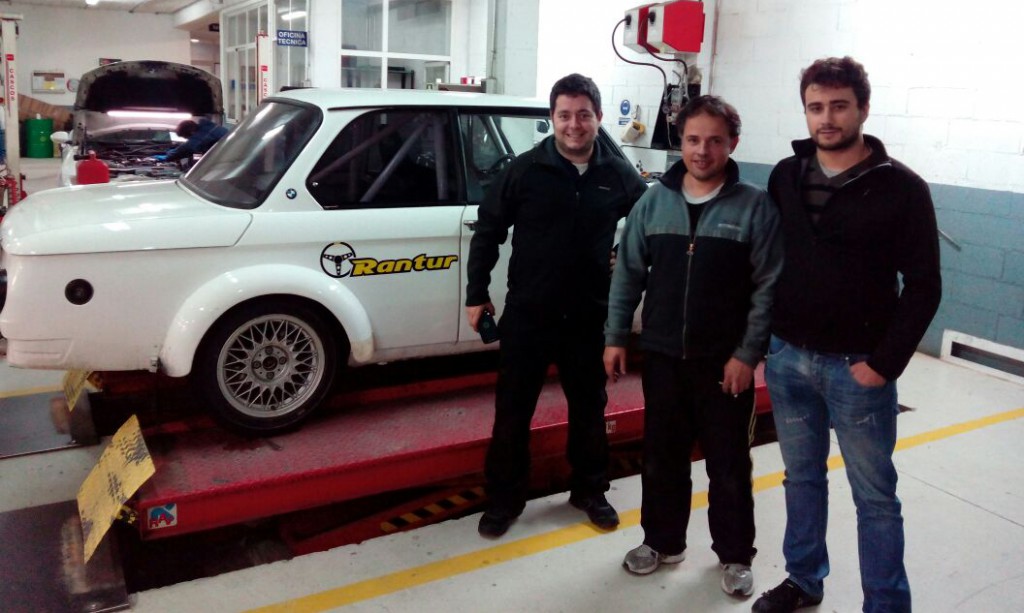
I was planning to add new features before continuing to test the data-logger, but we got a call from Talleres Rantur to work on the engine management unit in advance of the rally the following week. This was the perfect chance for a second test as Jorge González “Rantur” is a very fast and renown rally driver, having driven for both Citroën and Fiat in the Spanish Rally Championship.
The rallymix is conceived as an open road circuit with sectors of gravel and asphalt: on Saturday, three stages (laps); and on Sunday, two stages. Each stage is about 5.4 km, most of it gravel as we can see in the on-board video below. The video corresponds to SS4, in orange in the plots below.
Contents
GPS speed and positioning precision
Speed for the two last stages was measured using the GPS antenna and plotted against time in the figure below. Tight corners and a bumpy, muddy gravel road result in comparatively low speeds and poor acceleration (for instance, see minute 2:40 of the video, 1:35 in the plot below).
But, to which extent can GPS data be trusted? While standard accuracy is of about 15 m, GPS speed calculations are not subject to the same sources of error as the vehicle’s speedometer, but dependent on the satellite signal quality at the time. Signal arrival time measurement, and atmospheric and multipath effects are the main sources of signal inaccuracies.
From the GPS tracks above and on board video, it becomes clear that the vehicle speed and terrain orography have a significant influence on the quality of the signal. At slow speeds the ratio of positional error to positional change can be high while at higher speeds, where the road is straight and the land is clear, the ratio of positional error to positional change is lower, i.e., more accurate speed measurement. Error is also reduced through a moving average calculation in some devices.
Accelerations
The traction circle —more of an oval really— shows us how much overall traction our tires can supply at any given time. In this case, the car can accelerate faster —positive values— than it can slow down —negative values—, while the seems to be deviated towards the negative values due to the presence of slightly banked curves towards the outside on right-hand curves.
We would expected to see less traction on a gravel surface than on asphalt, but it would seem that Hankook is right when they claim that their Ventus R201 rally tires deliver excellent all around performance on various road conditions. Interestingly enough, maximum sustained lateral acceleration is achieved during a Scandinavian flick that leads to a powerslide around minute 2:13 (3:13 in the video) in contrast with the next left-hand hairpin turn with no power slide.
Vertical acceleration will show how bumpy the ride was for the drivers. This is a measure of the sprung mass vertical acceleration and can be logged at comparatively low rates —10 to 20 Hz—, while elements of the car under larger workloads require higher sampling rates. Suspension movement, for instance, need higher frequencies; in such cases, 200 Hz is often regarded as the minimum. While measuring at a low rate, several bump impacts were recorded during the race. The most notable bump took place right after hitting a pothole in the road around minute 3:18 (4:18 in the video) where the drivers experienced 3 g of vertical acceleration.
Race results
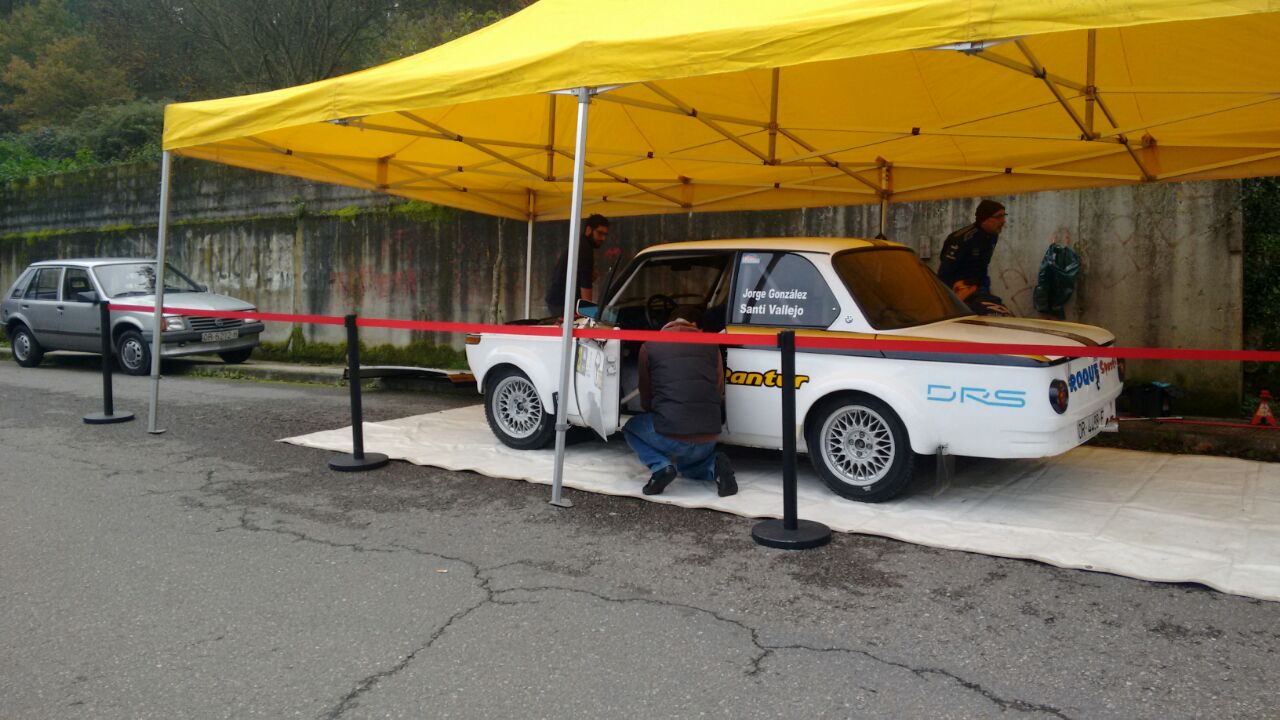
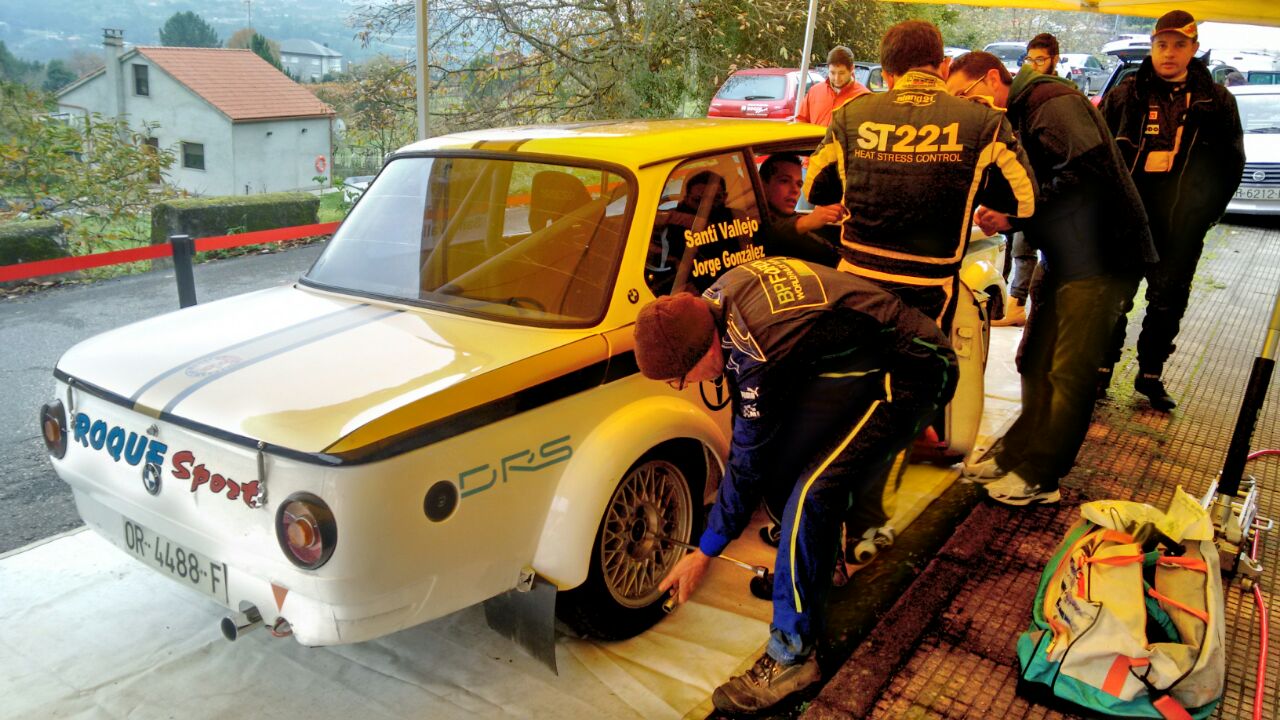
After two days and five laps, the BMW 2002 ti finished first in its class and 23rd overall.
| SS1 | SS2 | SS3 | SS4 | SS5 | Time | Diff. |
| 5:46.671 | 5:32.441 | 5:38.443 | 5:38.809 | 5:36.551 | 28:12.915 | +5:26.791 |


Acknowledgements
I’d like to thank Jorge González “Rantur” for letting me test the data logger on his car, and Santiago Vallejo for providing me with the on board video accompanying this post.