
Analysis of a lap around Brands Hatch Indy (Pt. I)
I wanted to feel like a race engineer so I went to Twitter and asked for some telemetry data for analysis. I got 3 GB worth of data from different drivers and circuits in a format suitable for MoTeC’s i2 data analysis software.
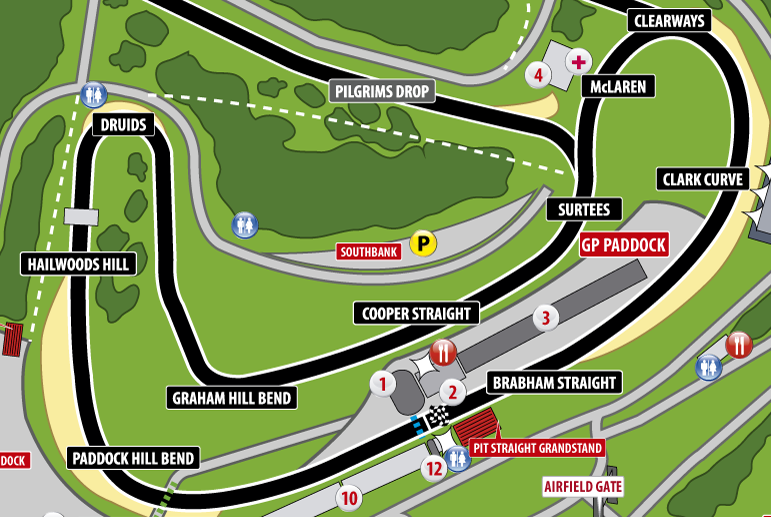
The circuit
Data is from a BMW Z4 GT3 racing at the Brands Hatch Indy Circuit, i.e., the short track. The circuit is very simple in layout, it offers a unique combination of fearsome corners and hills, dips and cambers.
The following video shows a lap at Brands Hatch in a BMW Z4 GT3.
Speed
Here I will compare two laps the best I can. The fastest lap (color lines) and the second-fastest lap (black lines) will be compared side by side.
The first parameter we will focus on is ground speed. That is, the speed of the race car relative to the ground, thus the higher the speed the faster the lap.
The BMW starts its fastest lap with already an advantage of 3.2 km/h reaching 234.1 km/h before preparing to take the Paddock Hill bend. Although being faster at the Brabham straight, the car moves slower through the curve so that the advantage gained is lost. In both laps the driver —Steve Barker— goes full throttle at the apex of Paddock Hill, but seems a little indecisive in his slower lap. There is no strange behaviour on steering wheel angle or lateral force which could explain why he didn’t go full throttle, and that translates to a slower speed through Hailwoods hill compared to his fastest lap.
During his fastest lap, Steve starts braking earlier on to prepare for Druids —this is the slowest curve in the circuit—, while on his slightly slower lap he holds on, braking later, and applies more power to stop the car faster. In this —eventually slower— lap, Steve starts on the throttle a few meters before the apex rationing the power output so that he goes into Graham Hill and through Cooper straight on a par with his fastest lap.
Both laps are still on par through Surtees, but on his second fastest lap Steve hesitates at McLaren and brakes a little bit earlier. Here he lost the chance for a faster lap. Steve, in his fastes lap, gets to the apex of Clearways at a speed 5 km/h faster administering the power output to not loose traction at the exit of the curve and going full throttle at Clark curve till the finish line with a clear advantage in top speed.
In conclusion,
If everything seems under control, you’re not going fast enough —Mario Andretti.
and as we might intuitively deduce, the faster we go, the less time it takes to complete the lap,
$$ d = \int\limits_{t_0}^{t_f} v\cdot dt $$
although depending on the racing line, the total distance covered for each lap will vary slightly.