The Answer is 27 with FANSI Motorsport
I’m really proud to be part of this amateur racing team. A couple of weeks ago, the car raced the 24 hours of Braga, a low cost endurance race aimed at motorsport enthusiasts with a constrained budget who want to feel the emotion of racing against each other in a circuit.
As a reward to collaborating with the team and organizers, the logo of this blog did appear in every competition number and clearly visible sponsoring FANSI’s BMW E30 318i.
![Figure 1. Four of the five drivers/mechanics/petrolheads of the team [left to right: Noel "the Stig(ster)" García, Ángel Nieto, Ana Castellano, and Víctor Ibáñez]. None of the them is me; but this blog is on the door.](https://theansweris27.com/wp-content/uploads/2014/02/fansi27.jpg)
Figure 1. Four of the five drivers/mechanics/petrolheads of the team [left to right: Noel “the Stig(ster)” García, Ángel Nieto, Ana Castellano, and Víctor Ibáñez]. None of the them is me; but this blog is on the door.
Contents
The 24 hours
Amazing. There is no other word to describe the event. More than 24 hours of team building, companionship, respect, and racing, big fun racing.
This year, the second time the car enters a 24 hour race event, the car managed to see the checkered flag. This was a huge success for the team, and for this we have to thank our few, but invaluable, sponsors. The car made 18 out of 33, though with more organization and a better strategy we could have done way better. I mean, we lost almost two hours changing the rear brake pads and a lack of coordination made the team waste about half an hour during the late night hours of the race.
You bastards, you’ve let me alone in the track! When I went back to the pits to refuel and change tires you were all sleeping in the caravan —Ana Castellano, fansi driver.
Of course, that on a pro team would have never happened. But we were amateurs. A total of 33 amateur teams, with 5 to 6 petrolheads per team. Nonetheless, it was about having fun, meeting new friends and racing. There were no trophies, no prizes; nothing but the satisfaction of ending a 24 hour race.
Basic data analysis
I am still working on my Arduino data logger. I’ve got some details pending implementation (e.g., a 9-DOF IMU) before putting it into the tests; but my colleagues there had the kindness to record several laps using Harry’s Laptimer for iPhone. So, let’s see what can we learn from the data.
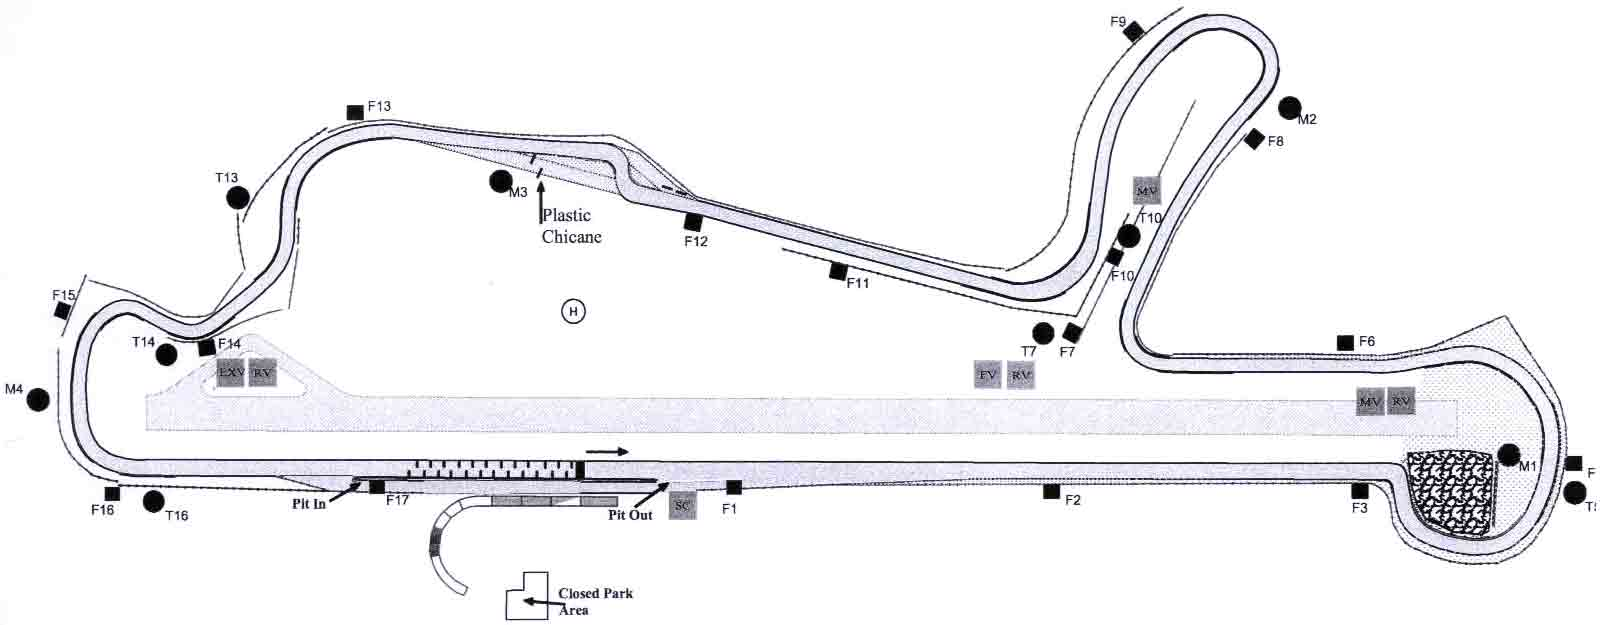
The circuit
But first of all, we need to know the track a little bit. The circuit of Braga is located 6 km north of Braga, Portugal. It was constructed in 1990 and is a counterclockwise 3020 km long, and 11 to 14 m width asphalt FIA-Grade 3 International Circuit (until 2011). A total of 13 curves: 7 left and 6 right. The longest straight: 898 m.
FANSI Motorsport is right in front of the car videotaping the formation lap:
Speed and accelerations
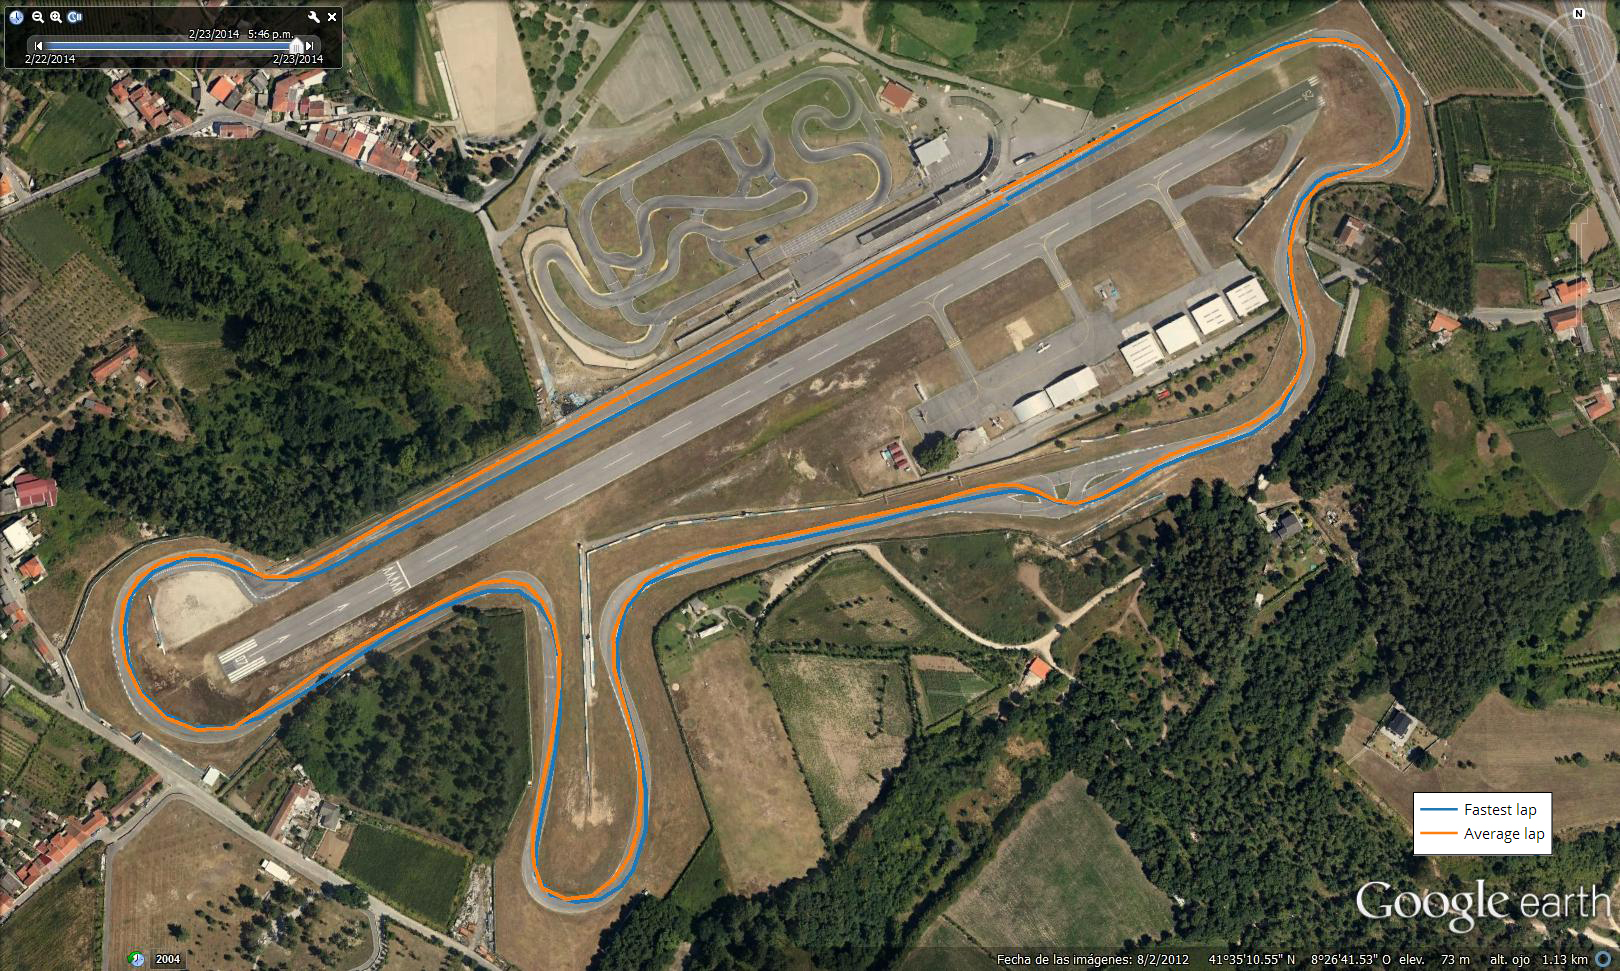
What we can see next is an overlaying of speed and acceleration comparing the fastest lap registered and an average lap during the event. As it was a 24 hour race, with 5 different people driving the car and with weather conditions ranging from wet surface with water puddles during Saturday through poor visibility due to heavy fog during the night, to dry asphalt during a sunny Sunday, no two laps are alike. The average sample lap was recorded at 02:07 and the fastest lap at 11:35, both on Sunday.
The fastest lap was set by Noel “the Stig(ster)” García in 1:45.749; that’s just 9 tenths of a second behind the overall fastest lap of the event in a car with just 115 hp and crappy brakes competing against some pro-drivers in cars with up to 200 hp.
Our fastest lap was set by Noel, who owns no car, does not drive regularly, and can hardly tie his shoelaces —Ángel Nieto.
In this fastest lap —compared to the average lap (1:55.8)—, the car gets to the end of the start-finish straight with a top speed ~5 kph faster and also starts braking 4 meters further. The car also takes the right turn at a faster speed taking advantage of all the grip available, according to the lateral g graph. In general the car is braking later and going faster through the right handers in the fastest lap while loosing less speed and momentum through the bend and at the exit, which in consequence allows the car to attain higher speeds in the straights.
The traction circle
The traction circle is useful to assess driver’s use of tyre grip. In theory, it’s possible to plot a circle which shows the absolute limits of grip, and a good driver will be able to operate at those limits. Although, truth is that the actual friction circle is closer to an oval in shape, and is usually a function of the shape of the tyre contact patch.
In the XY chart below, we can see how, in the fastest lap, the driver makes better use of the grip available in the right handers during the turn-in phase, gradually building up cornering force.
If we take a wider look and plot the friction circle for all the laps logged, we can see that there is a different approach on the turn-in and turn-out phase for righthanders and lefthanders. There is no symmetry, as would usually be expected from a professional driver. It seems that the grip of the tyre is maximised in the turn-in for righthanders and in the turn-out for lefthanders. This can partially be explained by the fact that, even though this is a counter-clockwise circuit, most of the straights lead to right-hand corners followed by long left-hand curves where the driver has plenty of time to build up speed while still cornering.
Racing lines
It is also interesting to see the different race lines followed in the two analysed laps. The GPS traces were recorded at 2 Hz with an estimated error of ±5 meters; nonetheless, some conclusions can be drawn from this. It is not very clear in the image, but the blue line is tracing the curves with a wider radius, which lets car go through the bends at higher speeds; hence the faster lap. It also explains the difference in running distance for both laps; a difference of 4 more meters ridden.
What next?
My next step is to complete the development of my Arduino data logger adding basic OBD capability and engine monitoring sensors besides retaining the same logging functionality found in Harry’s Laptimer. More on than in future posts.


