Computational study of the flow around the Ahmed vehicle model
The Ahmed vehicle model was introduced in 1984 by Ahmed et al. [1] to investigate the flow structure on the drag in the automotive industry. Experimental information can be used for developing, testing, and validating computer models of the aerodynamics of vehicular wake regions [3]

In this post I will study this simplified vehicle model and compare my results with those obtained experimentally and computationally by others.
Contents
Case set-up
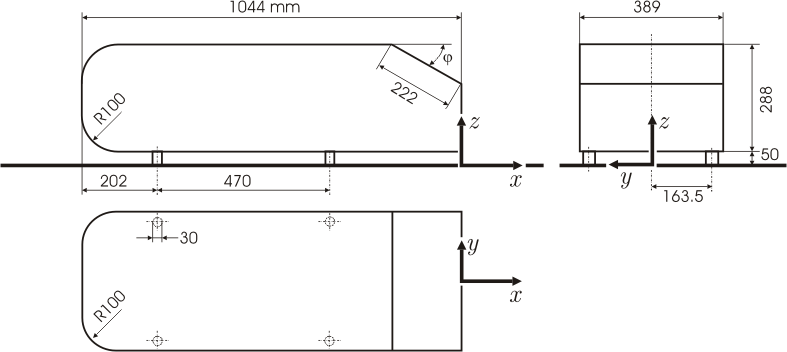
The geometry was modelled in STAR-CCM+ 9 parametrizing the slant angle so that computations can be automated. The fluid volume is 1.87×1.4 m2 (width×height) and 6 meters in total length, thus replicating the wind tunnel used by Lienhart and Becker [3] in their experiments. Whenever possible, results will be compared to those from Guilmineau [2] and Lienhart and Becker [3] papers.
Mesh
For this case, a trimmed cell mesh with prism layer and wake refinement was chosen. The total number of cells is roughly 2M, with a minimum cell size of 2.5 mm around the stilts and a maximum cell size of 50 mm far away from the body. The wake refinement goes all the way downstream.
Physics continuum
This is a three dimensional steady case for which a Coupled scheme was chosen. The gas is air, at standard sea level density of 1.225 kg/m3 and a dynamic viscosity so that the kinematic viscosity yields 15×10-6 m2s-1. The turbulence was modelled using both Spalar-Allmaras and SST K-Omega turbulence models with All y+ Wall Treatment.
Results
Simulations were performed until a successful level of convergence was reached. In the box plot below we have the quartiles of the last 500 iterations for the drag monitor.
From the experiment carried out by Ahmed [1] and the computational study done by Guilmineau [2] we have that the drag coefficients we are getting with STAR-CCM+ are of the same order of magnitude. Although we are overestimating the drag generated by the vehicle model as does Guilmineau [2] in his experiments, my values for the SST K-Omega are much higher. This can be attributed to a coarser mesh: 3.6 M cells against 3 M; or to different mesh refinement settings in key areas of the model. Further simulations should be carried out as to get a grid independent solution.
| Slant angle → | 25º | 35º | ||
| Turb. model ↓ | w/o stilts | w/ stilts | w/o stilts | w/ stilts |
| Spalart-Allmaras | 0.3404 | × | 0.3291 | × |
| SST K-Omega | 0.2895 | 0.3133 | 0.3074 | × |
| Experiment | × | 0.260 | × | 0.285 |
It is clear that both models overestimate the drag generated by the body. The location at which the flow separates determines the drag force —the wake flow is the region which presents the major contribution to a car’s drag [2].
In the following plot we have detailed the individual contributions to the overall drag of the model (C_S: Slant; C_B: Back; C_K: Blunt front; C_R: Other contributions to parasitic drag). We can appreciate a drastic change in drag around 30º due to a transition from an attached flow pattern towards a complex three-dimensional detached flow pattern.
Rear slant angle: 25º
Counter-rotating trailing vortices maintain the flow attached at the slant, although there is a very small recirculation region in the upper part of the slant surface [3]. Whilst all turbulence models tested by Guilmineau [2] predict separation just at the top of the slant —except the Spalart-Allmaras model—, they fail to predict the same reattachment seen in the experiment. This separation is not noticeable in my experiments.
K-Omega
Spalart-Allmaras
Rear slant angle: 35º
In this case we can see a fully separated flow-field. That is obvious when looking at the velocity vector profile in the symmetric plane in both turbulence models. Although there is a particular behaviour at the rear of the slant with the Spalart-Allmaras model where a very small vortex is created (seen the picture below). According to Guilmineau [2], this flow pattern was not found in the other turbulence models studied. In the wind tunnel experiment conducted by Lienhart and Becker [3], the flow detaches along the slanted surface developing a single large recirculation region within the wake.
K-Omega
Spalart-Allmaras
Summing up
Overlooking the fact that I can get a better solution by appropriately refining the mesh, this study case, even though geometrically simple, unveils the weaknesses of turbulence models in simulating the aerodynamics of vehicular wake regions. In words of Guilmineau [2]:
This case continues to pose strong challenges to the turbulence modelling.
References
[1] Ahmed, S., Ramm, G. and Faltin, G. 1984. Some salient features of the time-averaged ground vehicle wake. Changes, 2012 pp. 12–11.
[2] Guilmineau, E. 2008. Computational study of flow around a simplified car body. Journal of wind engineering and industrial aerodynamics, 96 (6), pp. 1207–1217.
[3] Lienhart, H. and Becker, S. 2003. Flow and turbulence structure in the wake of a simplified car model. SAE transactions, 112 (6), pp. 785–796.
[4] Hinterberger, C., Garcia-Villalba, M. and Rodi, W. 2004. Large eddy simulation of flow around the Ahmed body. Springer, pp. 77–87.


