Aerodynamics: McLaren MP4-29 front wing forces
In this post I am trying to investigate the influence of velocity in aerodynamic drag and downforce. A case like this is quite easily set up in STAR-CCM+ using a plugin named Optimate [1] which amongst its features includes Design Exploration mode:
In Design Exploration mode the values for the variable are supplied by user before the job is started. This mode is applicable when replicating test results, creating aerodynamics loads databases, compressor maps or any application when the configuration for each job is known a priori. There is no optimization taking place in Design Exploration mode.
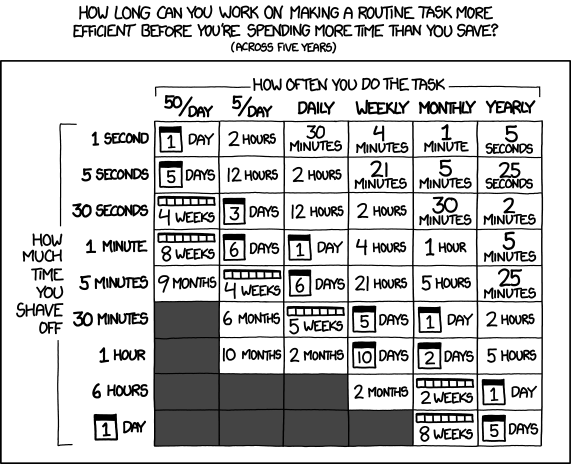
Unfortunately I do not have a license for it, but I can quite easily do it manually. So, should I write a macro? Is it worth the time? Well, the following Figure by Randall Munroe will give us a hint. Although this is not precisely a routine task, design exploration does perform multiple consecutive simulations and so a macro will release me from the unsavoury task of keeping an eye on the simulation —save the monitor values, set the new boundary conditions, re-run the case—, enabling the computer will work all day and all night long without idling. That is a lot of time I shave off.

Contents
Case study
For this case I will use an intermediate mesh (see previous post), Realizable K-Epsilon turbulent model with all y+ wall treatment, constant density of 1.18415 kg/m3 and steady state segregated flow.
A steady case with inlet velocity from 50 to 300 kph in steps of 50 kph is set in a Java macro which also instructs STAR-CCM+ to save drag and downforce values into a CSV file.
Results
Values for drag and downforce against velocity are depicted in the following plot.
The parabolic shape of both forces are due to their reliance on the square of the velocity as shown by
$$ F = \frac{1}{2}\rho C_{D,L}A V^2 $$
In fact, correlation is pretty close to 1, with small differences attributable to round-off errors.
Maximum downforce is about 550 kg and drag is just about 130 kg. This value for downforce is most likely underestimated while drag might be overestimated (see explanation in this post and its references, assuming absolute fidelity of the CAD geometry).
The next plot shows pressure coefficients on the main wing and flaps at 50 cm from the cars centerline for two cases.
We can appreciate almost identical values, also if we look at different representations. That should be no surprise as, in incompressible flow, the lift slope is not influenced by Re.
Another interesting aspect —which will require further investigation— is the generation of vortices. In the following video we can see how they quickly grow from edged reaching velocities up to 700 kph. That’s more that double of free stream velocity. According to Bernoulli*, that stands for very low pressure:
$$ p + \frac{1}{2}\rho V^2 = \text{constant along a streamline (or fluid, if irrotational)} $$
*Only holds for incompressible flow (Mach < 0.3 ~ 367 kph).
Acknowledgements
This study was possible thanks to CD-adapco’s Global Academic Program through which students have free access to individual licenses. Especial thanks to Juan David Barrera for providing the CAD geometry.
References
[1] CD-adapco, (2013). User Guide Optimate Version 8.06.002.
[2] Anderson, J. (2007). Fundamentals of aerodynamics. 4th ed. New York: McGraw-Hill.


