
The #F1SimStar submission explained
On the occasion of their three-week F1 workshops, SimScale and Nic Perrinn are launching a competition to look for the most creative visualization of airflow around a Formula 1 car. The rules?
- The visualizations must be created using the F1 car simulations provided on their F1 page.
- Every participant is allowed to submit a maximum of 3 images. Every image must be based on a different simulation.
These are my three images.
General aerodynamics
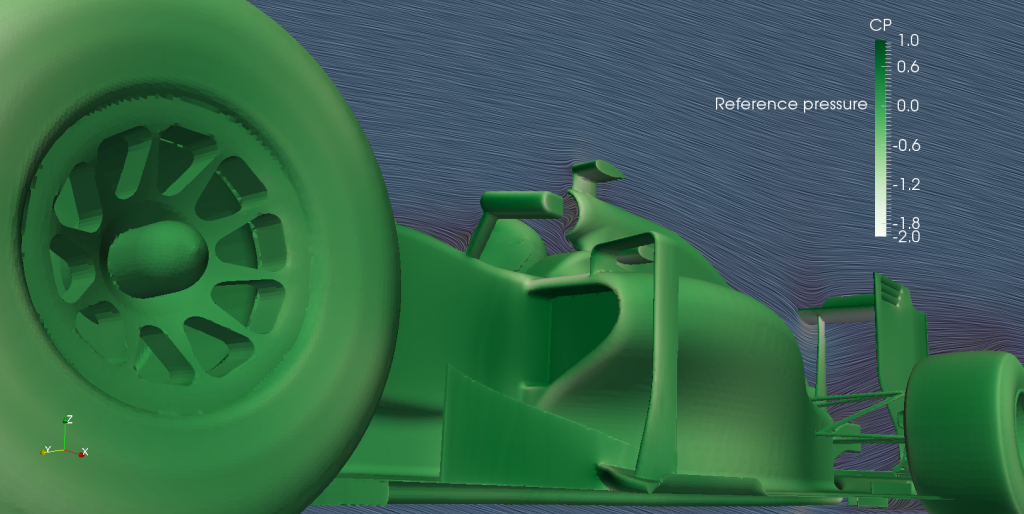
Close-up of Perrinn’s F1 car coloured by pressure coefficient in a scale of greens. The symmetry plane is a surface LIC visualization of the air, coloured by speed in a scale of blues. We can clearly appreciate the air bending around the rear wing.
Slip stream
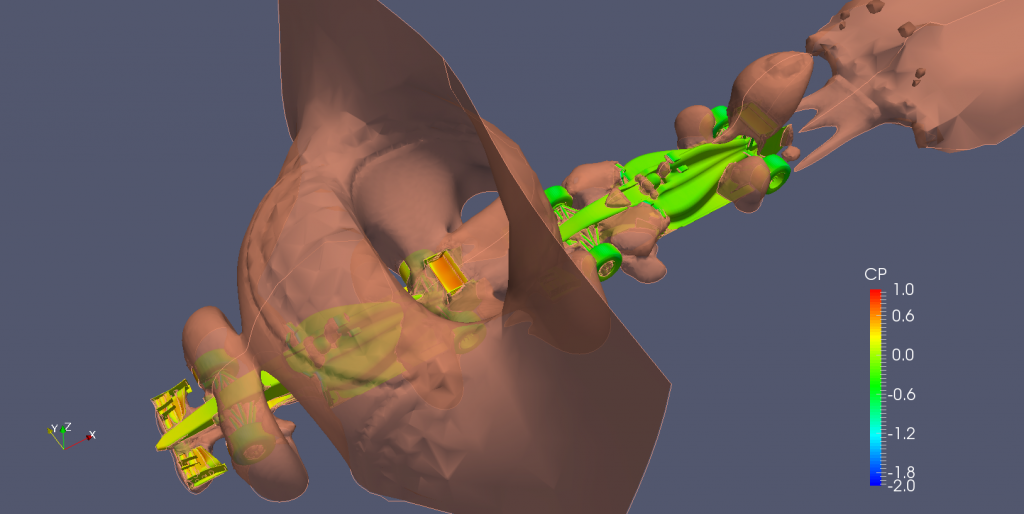
The two F1 cars are very close to each other. Body surface color represents the pressure coefficient in the classic rainbow scale. In addition, a contour plot representing the reference pressure has been included to show how differently the leading and trailing car interact with the freestream.
Overtaking manoeuvre
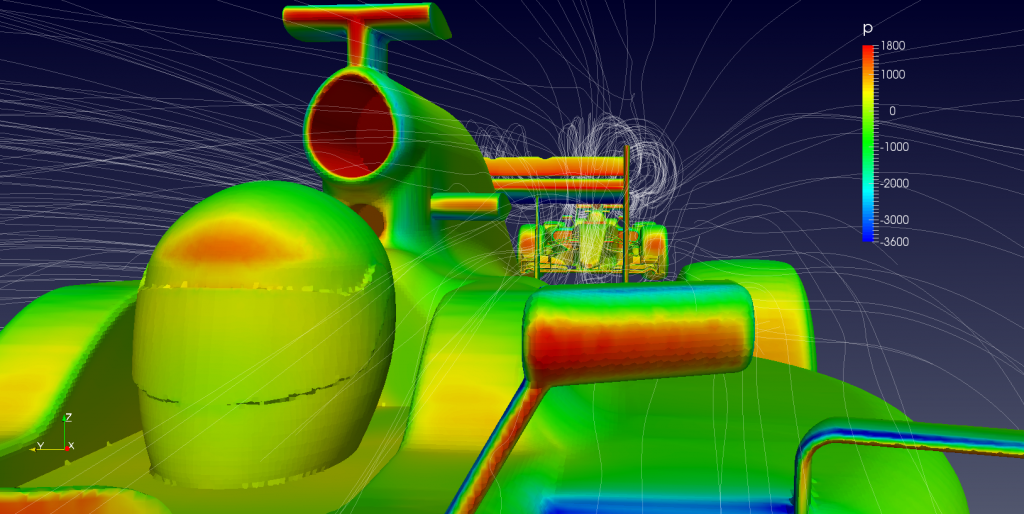
What would the leading driver see from his mirror o a rainy day? Probably just a white cloud, but streamlines give us a close approximation of rain’s trajectory if its Stokes number were much smaller than 1 ($\text{Stk} \ll 1$). That’s why wind tunnels use smoke, with low Stokes number, to visualize complex dynamic flow phenomena.