
Noise, noise, noise
Noise is a mayor concern when precise measuring is of utmost importance. Thus, before ordering the PCB I wanted to test the sensor on a prototyping board, and as I had the Sparkfun Inventor’s Kit running around I just placed all the wiring, compiled a small piece of code and turned it on.
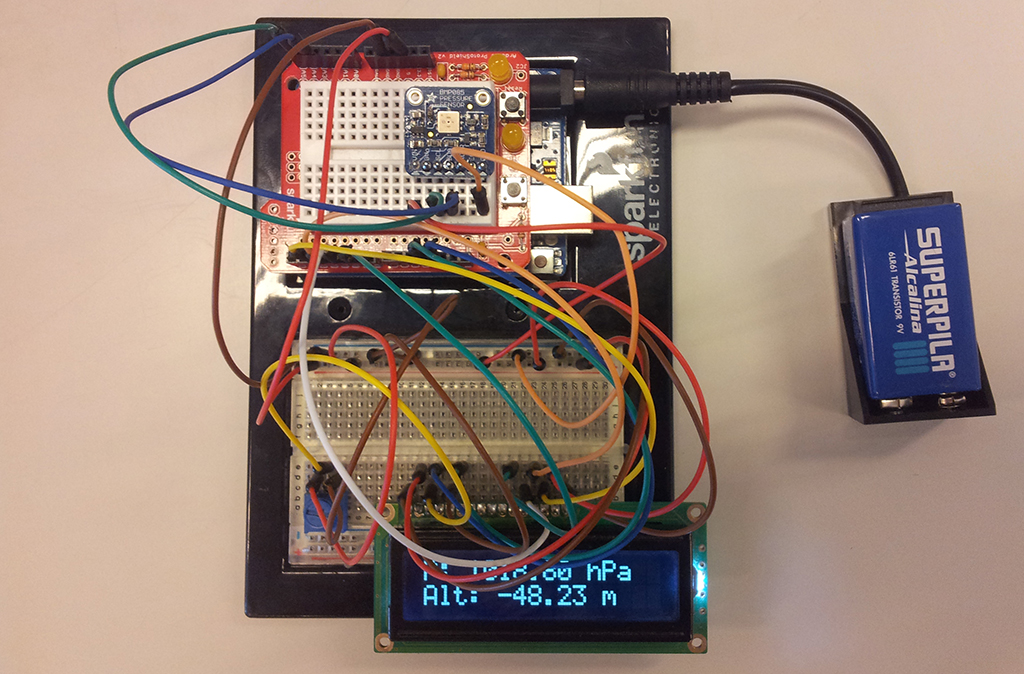
Figure 1. The Arduino UNO R3 reading the values from the barometric pressure sensor.
If the sensor is placed steady over a table in a room with quiet air, is it acceptable to have the samples shown in Figure 2? The variation is of about ±0.05 hPa which, at sea level, is equivalent to ±0.42 m. Of course, all of that should no come as a surprise as the Datasheet already warns about noise as we can see in the table below.
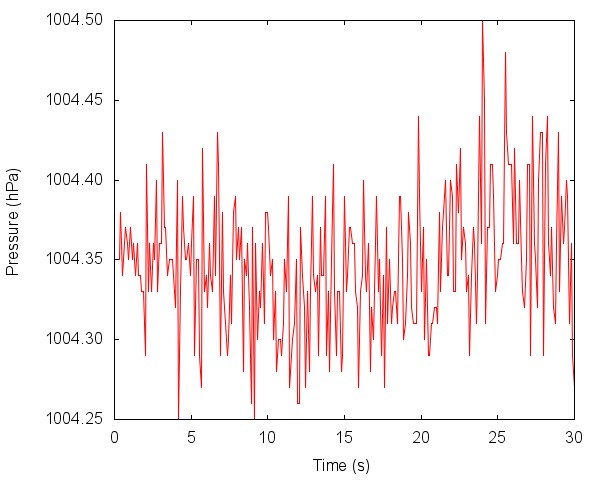
Figure 2. Barometric pressure sensor readings.
| Mode | Parameter oversampling_setting | Internal number of samples | Conversion time pressure max. [ms] | Avg. current @ 1 sample/s typ. [µA] | RMS noise typ. [hPa] | RMS noise typ. [m] |
| ultra low power | 0 | 1 | 4,5 | 3 | 0,06 | 0,5 |
| standard | 1 | 2 | 7,5 | 5 | 0,05 | 0,4 |
| high resolution | 2 | 4 | 13,5 | 7 | 0,04 | 0,3 |
| ultra high resolution | 3 | 8 | 25,5 | 12 | 0,03 | 0,25 |
Anyway, something should be done about it. For mitigating the effects of sensor noise, two general approaches are effective, low pass filtering with hardware, and low pass filtering with software. Obviously, hardware filtering is not an option as the pressure sensor comes already mounted on a PCB and the values are sent digitally over I2C.
I have to confess that I am not very good at choosing filters for signal smoothing; that’s a subject I have to improve on, but for now I am quite glad with the result of the Savitzky-Golay filter shown in Figure 3. This dataset in particular was smoothed with a second order polynomial fitted by linear least squares to a set of 121 adjacent data points. Might not be the best choice, but at least the filtered signal resembles what I would have traced by hand.
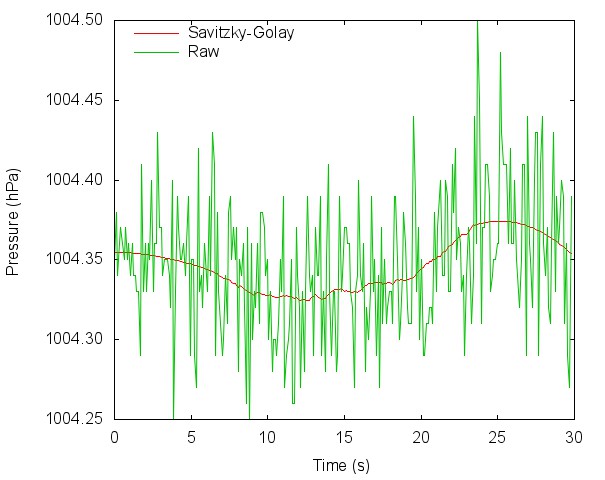
Figure 3. Data smoothed using the Savitzky–Golay filter.
Downside to this is that it is post-processing which, per se, is not something bad; but puts off analysis. I’m certain that there must be some kind of semi-automatic algorithm for signal smoothing because the rocket might reach above 10 to 15 meters in a matter of few seconds, whereas in this example the sensor was placed steady over a table. Sounds like a good reason to me for creating a GUI with PyQt. I’ll look further into the subject.